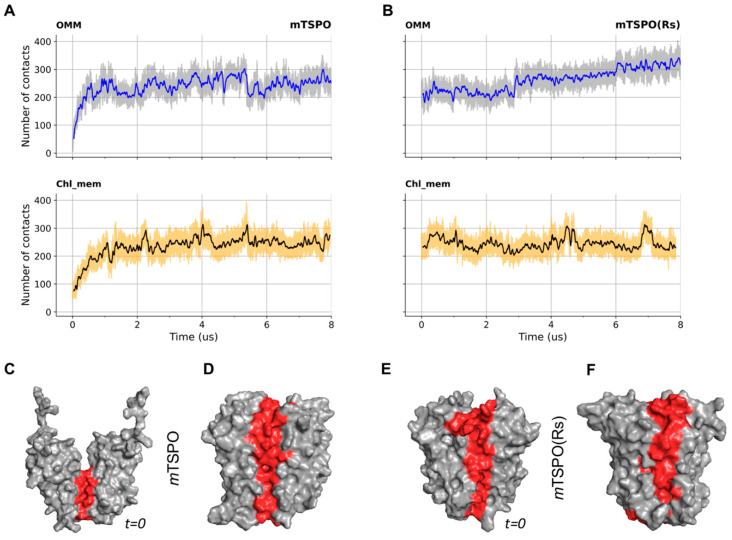
Figure 3.
Number of monomer–monomer contact beads as a function of the simulation time in OMM and chl_mem for (A) mTSPO, (B) mTSPO(Rs). A cutoff of 0.6 nm was used. Surface representation of mTSPO structures before (C) and after (D) equilibration in OMM, as well as mTSPO(Rs) structures before (E) and after (F) equilibration in OMM, are shown. Their surface is represented in grey color, except for the residues in contact at the dimer interface which are highlighted in red.

