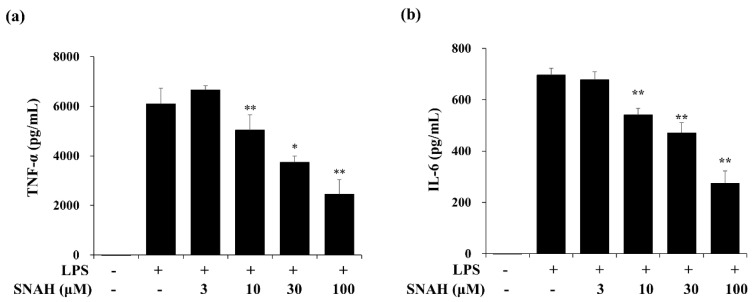
Figure 2.
Effects of SNAH on LPS-induced TNF-α (a) and IL-6 (b) production. RAW 264.7 cells were pretreated with 3, 10, 30, and 100 μM SNAH for 1 h before treatment with 1 μg/mL LPS. After incubation for 18 h, IL-6 and TNF-α production was detected by ELISA. The values are presented as means ± SD of three independent experiments. * p < 0.05, ** p < 0.01 compared to the LPS-treated group.

