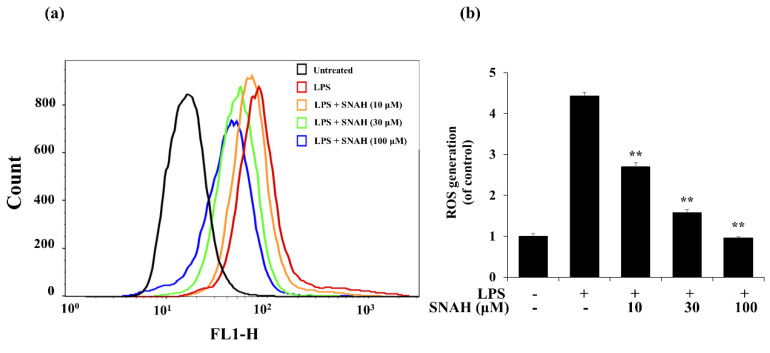
Figure 5.
Effects of SNAH on LPS-induced ROS (reactive oxygen species) production. (a) RAW 264.7 cells were pretreated with 10–100 μM SNAH for 1 h before treatment with 1 μg/mL LPS for 18 h. Cells were incubated with 10 μM 2′,7′-dichlorofluorescein diacetate (DCFH-DA) for 30 min at 37 °C. Then, cells were harvested, and dichlorofluorescein (DCF) fluorescence was immediately analyzed by flow cytometry. DCF fluorescence intensity was determined from the same numbers of cells in a randomly selected area. (b) The mean relative ROS level is presented in a bar graph. The values are presented as means ± SD of three independent experiments ** p < 0.01, compared to the LPS-treated group.

