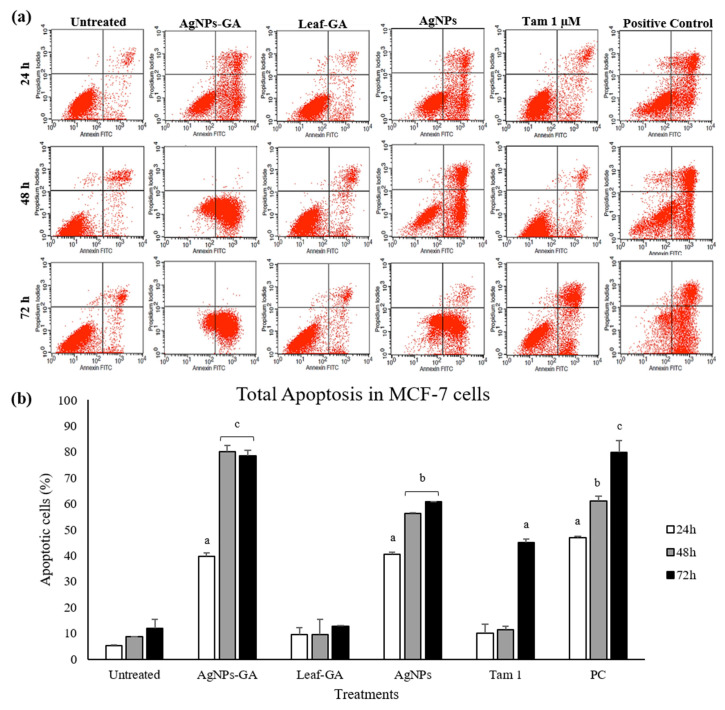
Figure 11.
(a) Representative dot plot showing annexin-V-FITC-/PI- (lower left quadrant/viable cells), annexin-V-FITC+/PI− (lower right quadrant/early apoptotic cells), annexin-V-FITC+/PI+ (upper right quadrant/late apoptotic cells) and annexin-V-FITC-/PI+ (upper left quadrant/necrotic cells) in MCF-7 cells as acquired by flow cytometry. (b) Percentage of total apoptosis (early and late apoptosis) in MCF-7 cells after 24–72 h incubation period with medium alone (untreated), AgNPs-GA (15 µg/mL), leaf extract (100 µg/mL), AgNPs (100 µg/mL), tamoxifen (1 µM) and positive control (tamoxifen 30 µM). Data shown are the mean values ± S.D. for three independent experiments. Statistical analysis was performed using Student’s t test with a p < 0.05, b p < 0.01 and c p < 0.001, significantly different to untreated cells.

