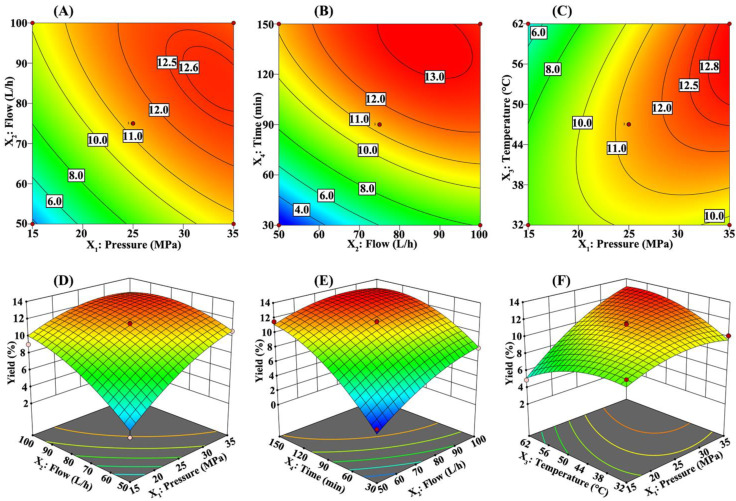
Figure 2.
Two-dimensional (2D) contour graphs and three-dimensional (3D) surface graphs of the significant interaction items in the response surface model. (A,D) 2D contour graphs and 3D surface graphs showing the effects of pressure (X1) and flow (X2) on the yield at fixed temperature (X3 = 47 °C) and time (X4 = 90 min), respectively. (B,E) 2D contour graphs and 3D surface graphs showing the effects of flow (X2) and time (X4) on the yield at fixed pressure (X1 = 25 MPa) and temperature (X3 = 47 °C), respectively. (C,F) 2D contour graphs and 3D surface graphs showing the effects of pressure (X1) and temperature (X3) on the yield at fixed flow (X2 = 75 L/h) and time (X4 = 90 min), respectively.

