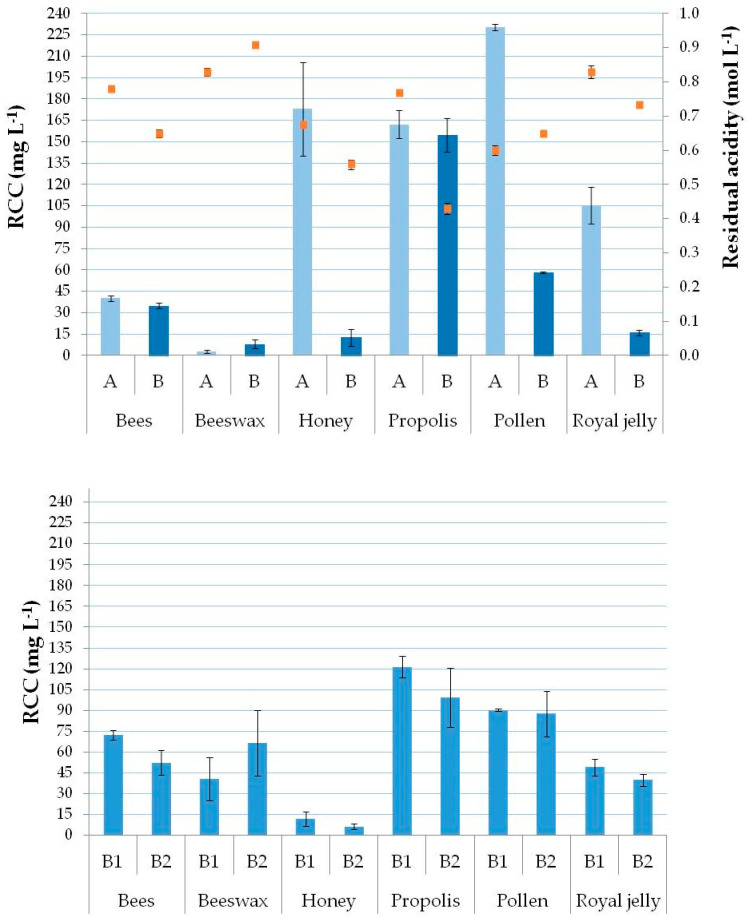
Figure 1.
Sample treatment (A = open-vessel digestion heated with water bath, B = closed-vessel microwave-assisted digestion with HNO3/H2O2 mixture, B1 = closed-vessel microwave-assisted digestion with aqua regia/H2O2 mixture, and B2 = closed-vessel microwave-assisted digestion with aqua regia/HF mixture) effect on bees and beehive products digestion efficiency. Bars represent residual carbon content (RCC; left Y axis; n = 3) and line (-□-) represents residual acidity (right Y axis; n = 3).

