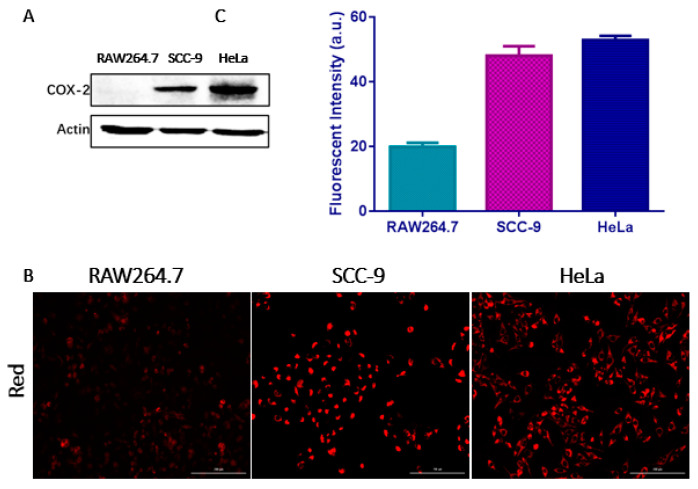
Figure 5.
(A) Western blot showing COX-2 expression level in RAW 264.7, SCC-9 and HeLa cells. (B) Fluorescence images of RAW 264.7, SCC-9 and HeLa cell lines with fluorescent microscopy. All cells were treated with CCY-5 (1 μM) for 30 min (λex: 628 nm; Red, λem: 685 nm; All the images share the same scale bar: 200 µm). (C) Quantitative image analysis of the average total fluorescence intensity of HeLa, SCC-9 and RAW 264.7 cells (n = 3). * p < 0.05.

