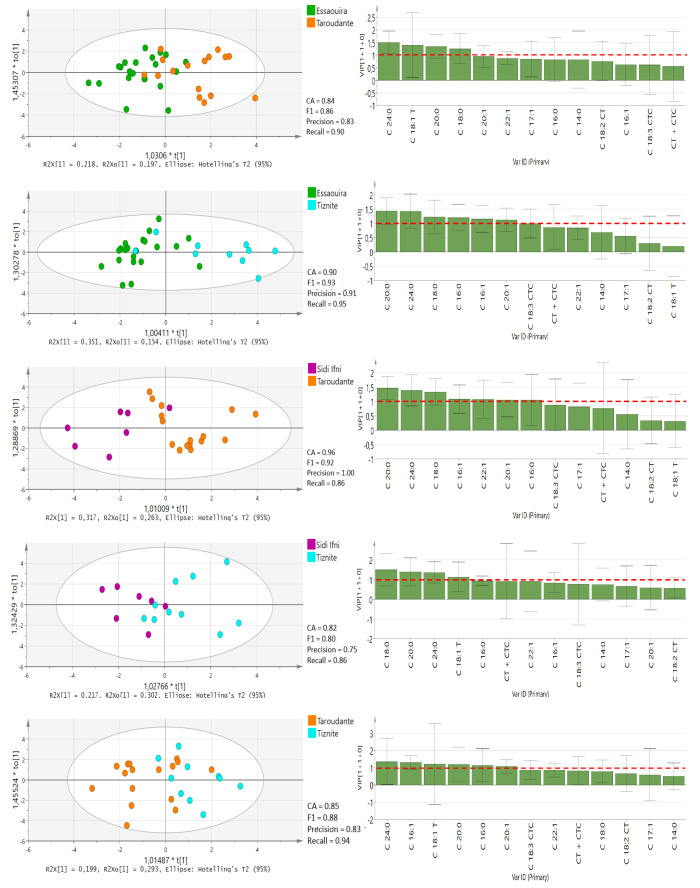
Figure 5.
OPLS-DA score plots with VIP values in the pairwise comparison between different provinces derived from all fatty acid compositional data. The red-dotted line at VIP = 1.0 indicates criteria for the identification of the most important model variable. CT + CTC, total trans-linoleic + trans-linolenic isomers (C18:2 CT + C18:3 CTC).

