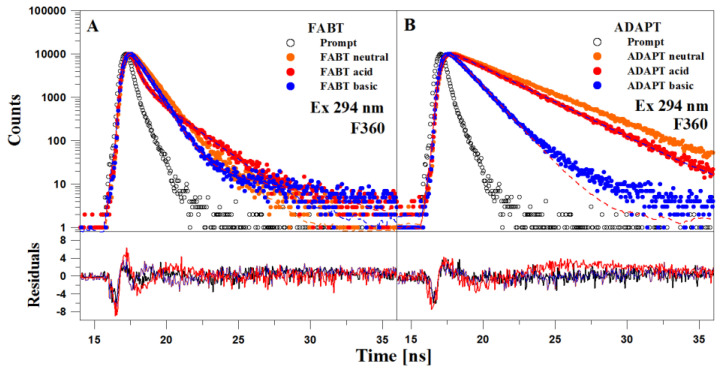
Figure 6.
Panel (A). TCSPC analysis for FABT in EtOH and EtOH with the addition of acid and base (apparent pH). The top panel presents the decay of fluorescence intensity. Black color denotes the apparatus profile. Points correspond to measurement results and the continuous line to the double component analysis. The bottom panel presents the distribution of residuals. The excitation wavelength was 294 nm. Panel (B). TCSPC analysis for ADAPT in EtOH and EtOH with the addition of acid and base (apparent pH). The top panel presents the decay of fluorescence intensity. Black color denotes the apparatus profile. Points correspond to measurement results and the continuous line to the double component analysis. The bottom panel presents the distribution of residuals. The excitation wavelength was 294 nm, fluorescence emission was recorded for wavelength >360 nm (emission filter F360).

