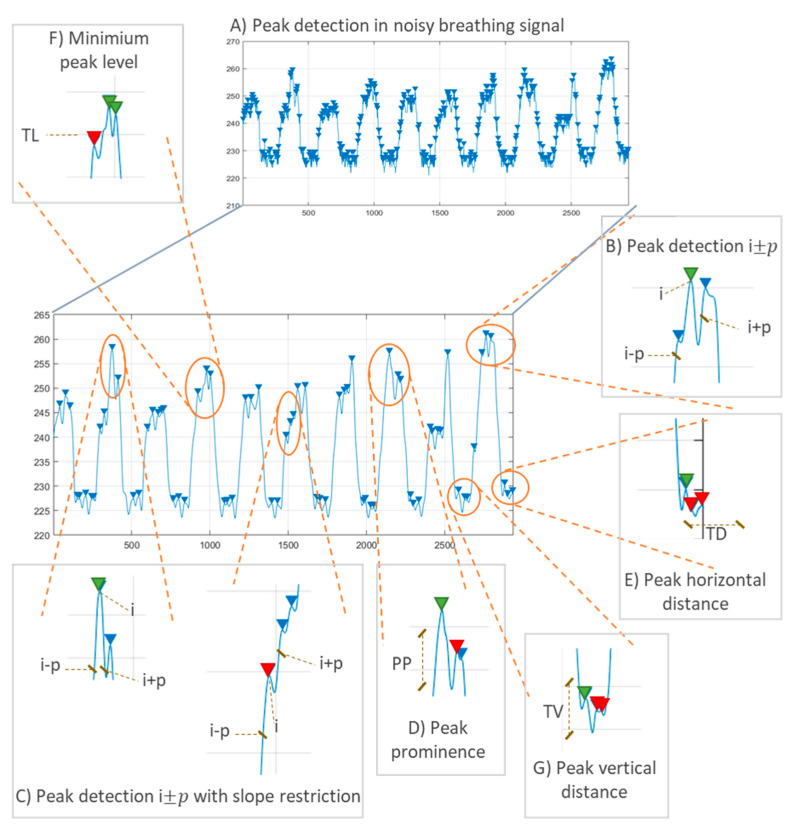
Figure 29.
Peak detection of a sample respiration signal obtained from the public breathing dataset published in Reference [254]. (A) Peak detection of a noisy signal without filtering. (B) Peak detection imposing a restriction of p surrounding number of samples (in green the peak accepted). (C) Example of a peak accepted (left, green peak) and a peak discarded (right, red peak) when applying the slope restriction. (D) Example of a peak reaching (green) and not reaching (red) the minimum prominence level PP to be considered a valid peak. (E) Example of two peaks (red) not fulfilling the minimum horizontal distance restriction TD. (F) Example of a peak (red) not fulfilling the vertical minimum level restriction and two peaks that surpass level TL (green peaks). (G) Example of two peaks discarded (red) for not differing the imposed tidal volume (TV) level from a detected peak (green).

