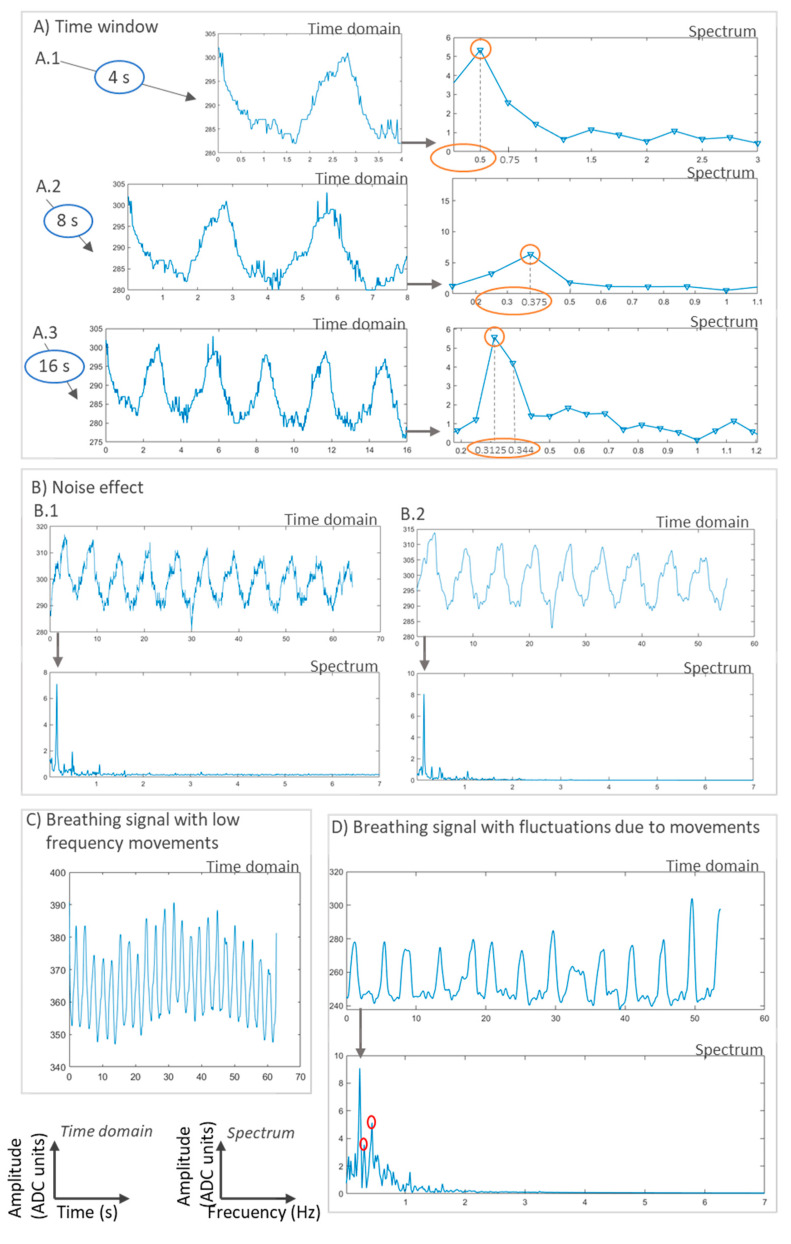
Figure 31.
Frequency analysis of sample real respiratory signals obtained from a public dataset [254]. (A) Effect of the time window (4 s, 8 s, and 16 s) on the frequency calculation. The true frequency is 0.33 Hz (3 s period) and the sampling frequency is 50 Hz. Results for the 16-s time window (Table A3, 0.3125–0.344 Hz) are closer to the true value. (B) Effect of noise on frequency detection (noisy signal and its spectrum -B.1-, filtered signal and its spectrum -B.2-). (C) Example of a breathing signal with low frequency fluctuations. (D) Example of a breathing signal with fluctuations due to movements of the subject and its spectrum.

