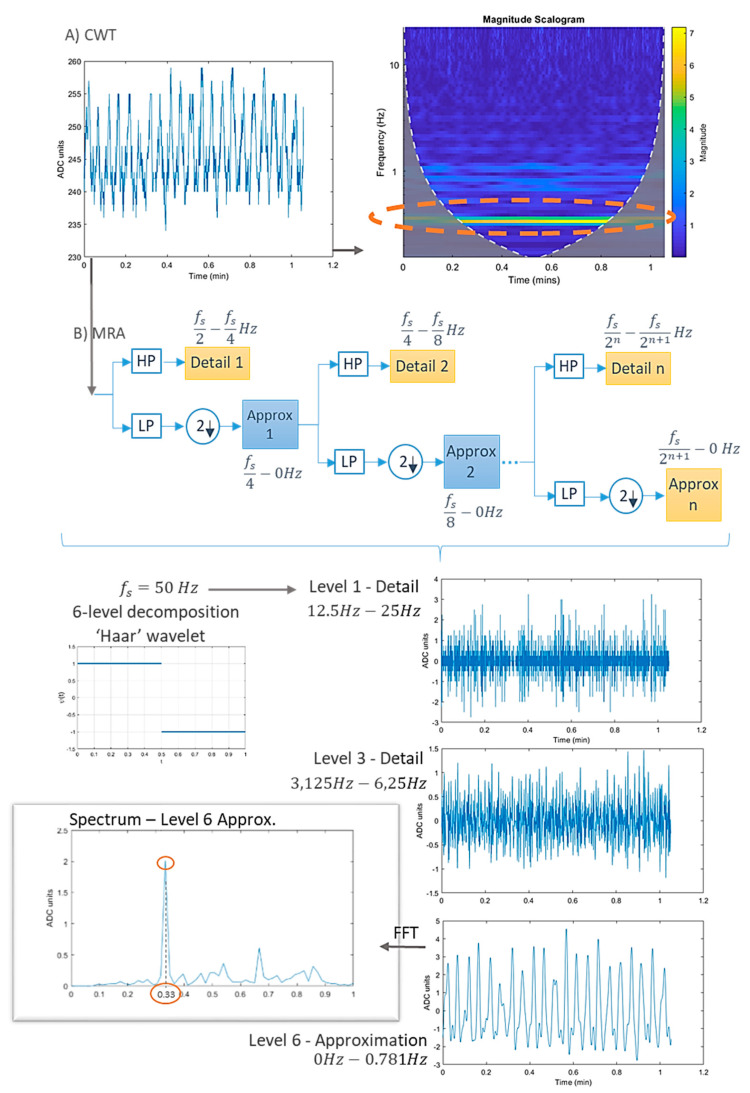
Figure 32.
Wavelet transform. (A) 2D representation of the continuous wavelet transform (CWT) (right) of an example signal (left) taken from a dataset of real respiration signals [254] (RR of 20 bpm −0.33 Hz-, and sampling frequency of 50 Hz). (B) Multiresolution analysis (MRA) decomposition process (top). The lower part shows an example of the MRA analysis applied to the signal above ((A), left). Six-level decomposition was applied using the ‘Haar’ wavelet. Two detail levels and the sixth approximation level are represented. The spectrum of the approximation coefficients (level 6) was obtained.

