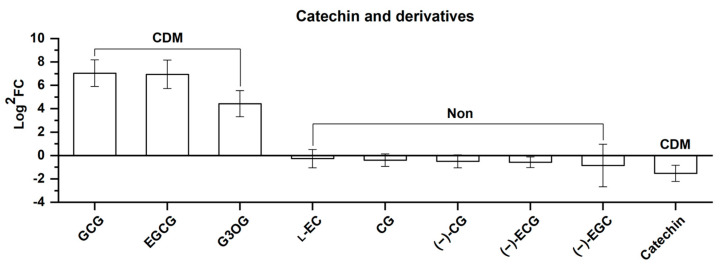
Figure 8.
Comparison of nine catechins and catechin derivatives, including 4 CDMs and 5 non-differential metabolites (Non) between SJL and SN. Upregulation denotes that the content of a metabolite increased in SN compared with that in SJL, and the opposite for downregulation. The Y-axis is exhibited as Log2FC values for the convenience of visual presentation (note that the up and down amplitudes in the text refer to the FC value). The X-axis denotes the metabolite names. Abbreviation: GCG, (−)-gallocatechin gallate; EGCG, epigallocatechin gallate; G3OG, gallocatechin 3-O-gallate; l-EC, l-epicatechin; CG, catechin gallate; (−)-CG, (−)-catechin gallate; (−)-ECG, (−)-epicatechin gallate; (−)-EGC, (−)-epigallocatechin.

