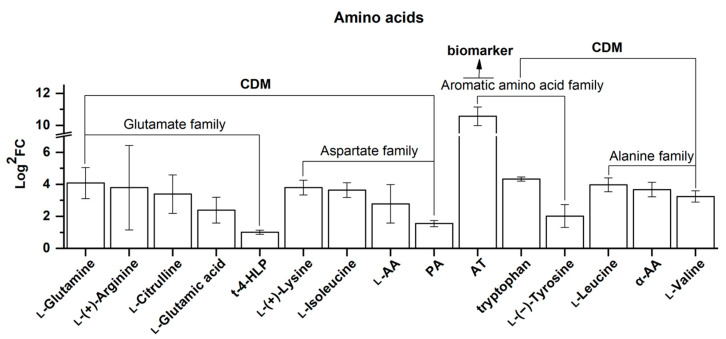
Figure 12.
Comparison of amino acids, consisting of 1 biomarker and 14 CDMs between SJL and SN. They are clustered into four families, namely the glutamate family, aspartate family, aromatic amino acid family, and alanine family. Upregulation denotes that the content of a metabolite increased in SN compared with that in SJL. The Y-axis is exhibited as Log2FC values for the convenience of visual presentation (note that the amplitude in the text refers to the FC value). The X-axis denotes the metabolite names. Abbreviation: t-4-HLP, trans-4-hydroxy-l-proline; l-AA, l-asparagine anhydrous; PA, pipecolic acid; AT, acetyl tryptophan; α-AA, alpha-aminocaproic acid.

