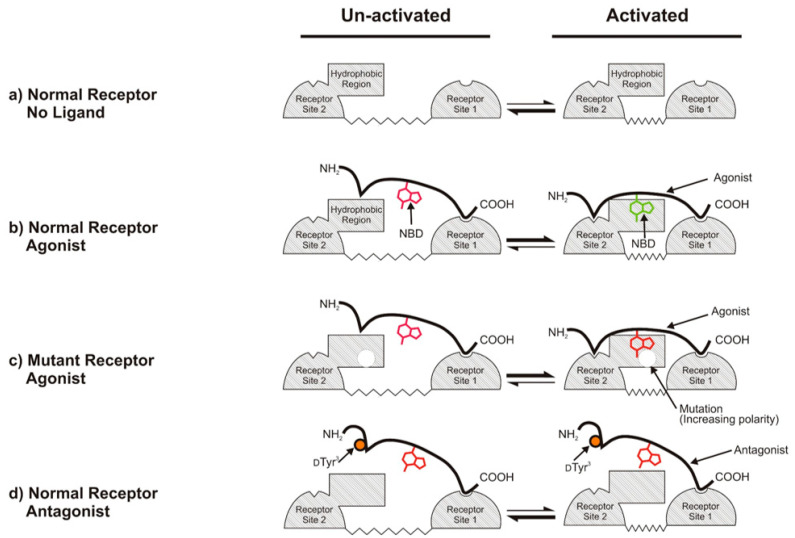
Figure 7.
Model for the binding and activation of normal and mutant α-factor receptors by different ligands. Ligand-interacting surfaces on the receptor are indicated by cross-hatching. Site I interacts with the C-termini of ligands and is likely to consist of the extracellular end of the first transmembrane segment. Site 2 interacts with the N-terminus of ligands and most likely consists of the extracellular end of the sixth transmembrane segment and the third extracellular loop of the receptor. The conformational equilibrium between the inactive and activated states of the receptor is represented as a change in the distance between Site 1 and Site 2. (a) In the absence of ligand, the receptor favors the inactivated state with a large separation between ligand contact sites. (b) Binding of the agonist to normal receptors favors the activated state. (c) Mutations affecting the emission spectrum of bound agonist change the environment of the fluorophore (red shift) without altering the receptor ligand binding or, generally, activation. (d) Binding of ligands that act as antagonists toward normal receptors (labeled antagonist) does not alter the conformational equilibrium of the receptor. Activation-specific interactions with the N-terminus of the ligand are blocked by the d-Tyr3 substitution (orange circle), leaving the NBD group attached at Lys7 exposed to the solvent, and the C-terminal region of the antagonist (which is identical to the corresponding region of agonist) maintains a high-affinity interaction with the receptor. Adapted with permission from [71].

