Figure 3.
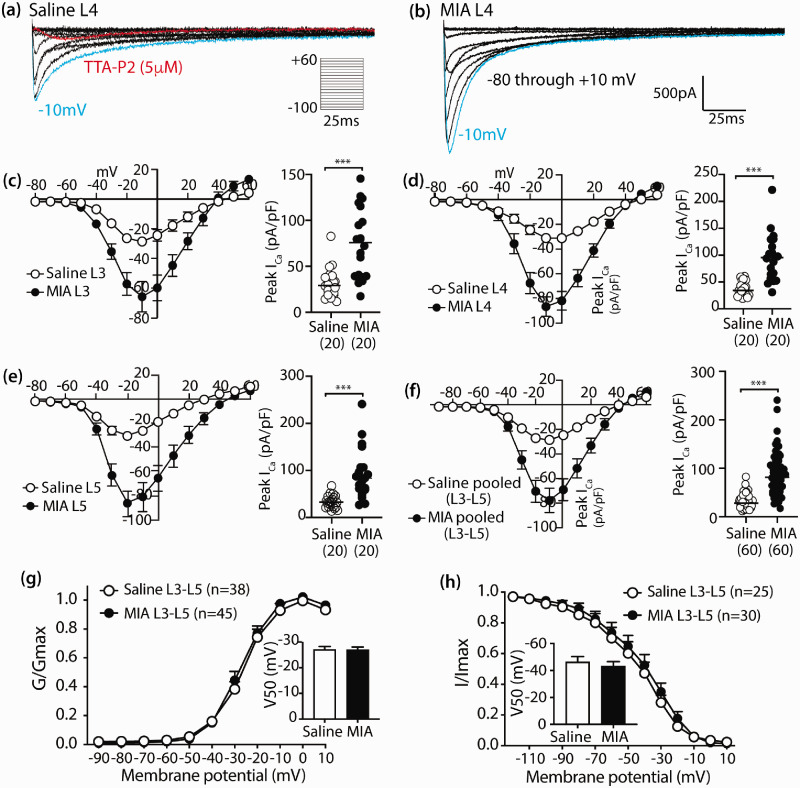
Enhanced T-type Ca2+ current in PSNs after MIA treatment. Representative traces of T-type ICa from L4 PSNs dissociated from the saline (a) and MIA-treated rat (b) five weeks after injection. ICa is evoked by command voltage steps from −90 mV (holding potential) to a test potential from −80 to +60 in 10 mV increments. Scatter and line plots show I–V relationships of the grouped data in the saline (open circles) and MIA groups (filled black circles) recorded in the small- and medium-sized PSNs dissociated from L3 (c), L4 (d), and L5 (e) DRG, as well as L3–L5 pooled data (f); with scattered dot plots with medians on the right of each panel summarized peak ICa density; *** denote p < 0.001 by two-tailed unpaired Student’s t tests for comparison between saline and MIA groups, respectively. The number in each bracket below x axis is the PSN numbers recorded per group. The plots (g and h) show the voltage-dependent activation and steady-state inactivation curves in two groups, with insets showing half activation and half inactivation, respectively.

