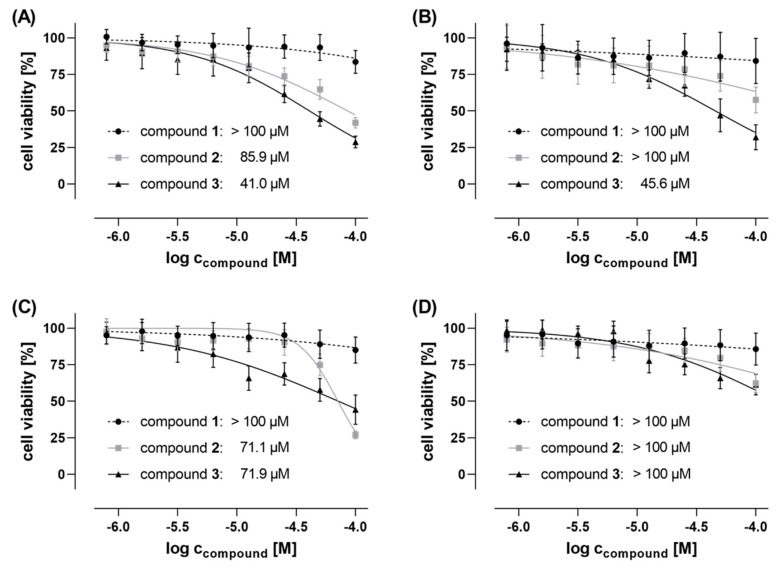
Figure 5.
Cell viability of (A) breast cancer MDA-MB-468 cells, (B) breast cancer MDA-MB-231 cells, (C) Ewing’s sarcoma SK-N-MC cells, and (D) prostate cancer PC-3 cells treated for 48 h with compounds 1 (●), 2 (■), and 3 (▲), respectively, as determined by MTT assay. Data has been normalized to cell viabilities between 0% (represented by digitonin-treated cells; cytotoxic positive control) and 100% (represented by untreated cells; negative control). IC50 values of the anti-proliferative/cytotoxic compound activities have been calculated by using GraphPad Prism 8.0.2 software and are given in micromole concentrations. Data has been collected in two independent biological replicates each with technical quadruplicates.

