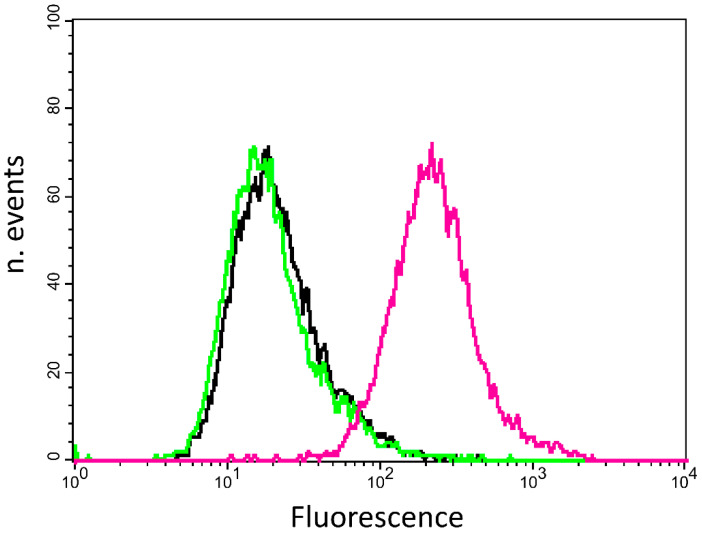
Figure 1.
Quantification of αvβ3 and αvβ5 receptors on HepG2 cell surface. Cells were stained with phycoerythrin (PE)-anti-αvβ5 antibody (magenta curve) or PE-conjugated anti-αvβ3 antibody (green curve) or PE-control isotype (black curve). The histogram is representative of three independent experiments.

