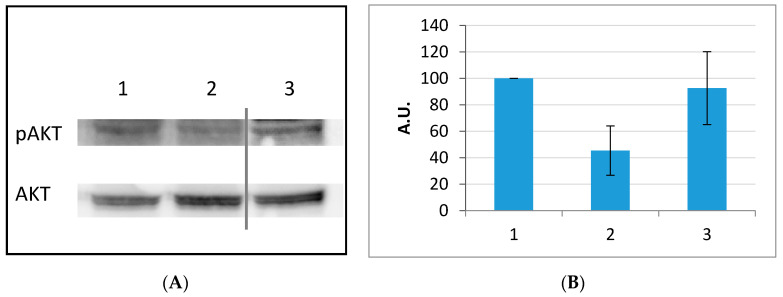
Figure 8.
Western Blotting of pAKT. Analysis of the AKT phosphorylation state after peptide treatment was carried out on HepG2. Cells were treated with the RGDechi15D peptide for 1 h. (A) Total cellular extracts (50 μg) were resolved by SDS PAGE and analyzed by Western blotting with anti-pAKT (Ser473) and anti-AKT antibodies. The Western blotting is representative of three independent experiments. (B) Bar graph illustrates the percentage of band quantification respect to the control. 1 = Control, 2 = RGDechi15D, 3 = Scrambled peptide. The results are expressed as mean ± SE of percentage of pAKT normalized to the density of AKT.

