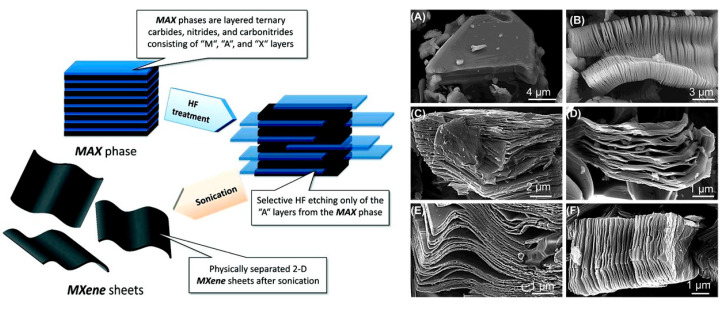
Figure 1.
(Left) Schematic for the exfoliation process of MAX phases and formation of MXenes. (right) SEM micrographs for (A) Ti3AlC2 MAX phases, (B) Ti3AlC2 after HF treatment, (C) Ti2AlC after HF treatment, (D) Ta4AlC3 after HF treatment, (E) TiNbAlC after HF treatment, and (F) Ti3AlCN after HF treatment. Reprint with permission [2]. Copyright © 2012, American Chemical Society.

