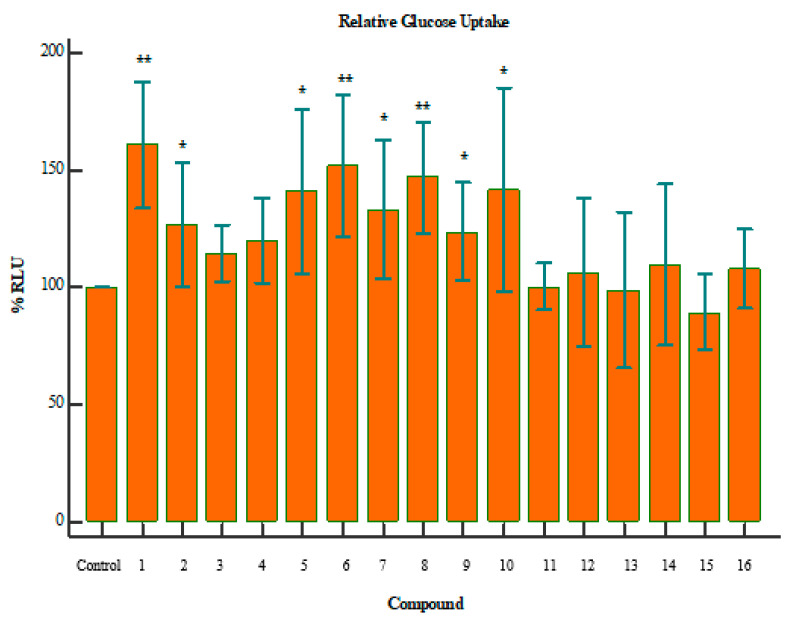
Figure 2.
Relative glucose uptake of compounds 1–16; where the p-value is indicative of the statistical significance versus the control, using an independent two-tailed T-test. * p < 0.05, ** p < 0.01. Compounds 1 (p = 0.0031), 8 (p = 0.0053), and 6 (p = 0.0086) showed a marked increase in glucose uptake.

