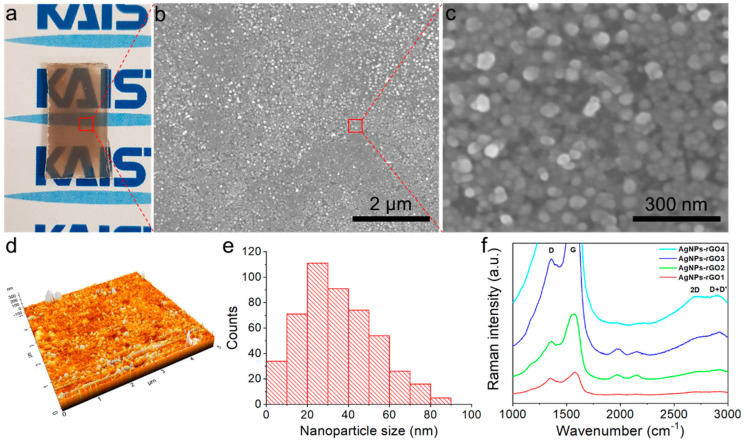
Figure 2.
Characterization of the AgNPs-rGO composites. (a) Photograph of the AgNPs-rGO1 SERS substrate; (b,c) The SEM images clearly showed the narrow nanogap-rich structures; (d) Atomic force microscopy (AFM) images of the AgNPs-rGO1 substrate; (e) Particle size distribution of the AgNPs-rGO1 substrate exhibiting the median size of AgNPs was 33 nm; (f) Raman spectra of various AgNPs-rGO composites. The D and G Raman bands of the AgNPs-rGO3 and AgNPs-rGO4 substrates were not figured as the signals were saturated.

