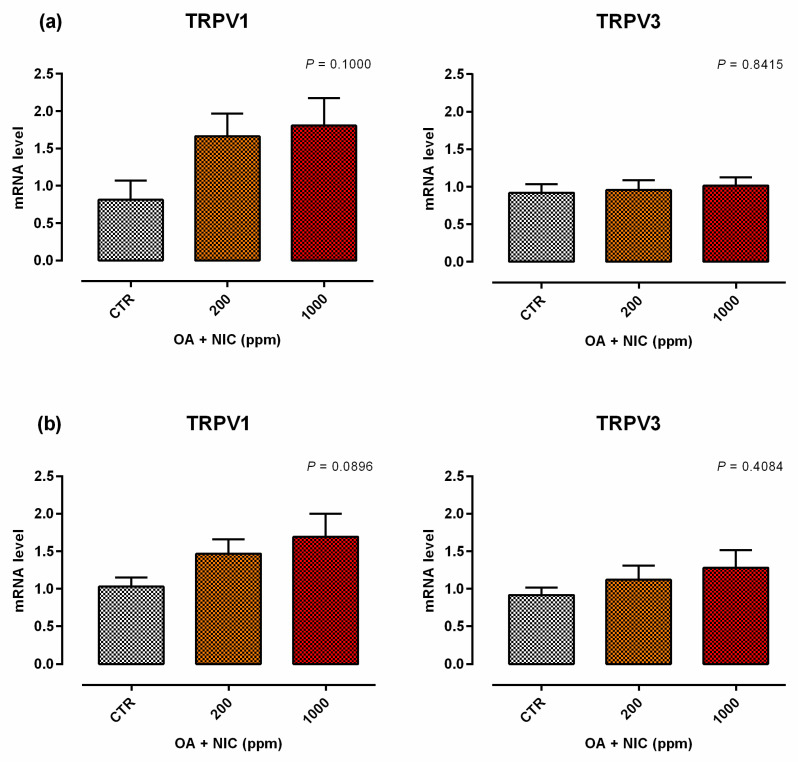
Figure 11.
Gene expression in Caco-2 cells after 15 days of treatment with OA + NIC and subjected to an inflammatory challenge. Values are least square means (n = 6) ± SEM represented by vertical bars. A modification of the 2–ΔΔCT method [16] was used to analyze the relative expression (fold changes), calculated relative to the control group. Means with different letters indicate statistical significance with p < 0.05 (a, b); means with at least one common letter are not significantly different (ab). CTR = control group; OA + NIC 200 = treated group with 200 ppm of OA + NIC, composed by 260 µM of citric acid, 298 µM of sorbic acid, 23 µM of thymol, and 13 µM of vanillin; OA + NIC 1000 = treated group with 1000 ppm of OA + NIC, composed by 1300 µM of citric acid, 1490 µM of sorbic acid, 110 µM of thymol, and 70 µM of vanillin; TRPV1 = Transient Receptor Potential Vanilloid 1; TRPV3 = Transient Receptor Potential Vanilloid 3. (a) Cells challenged at day 0 of the study. (b) Cell challenged at day 14 of the study.

