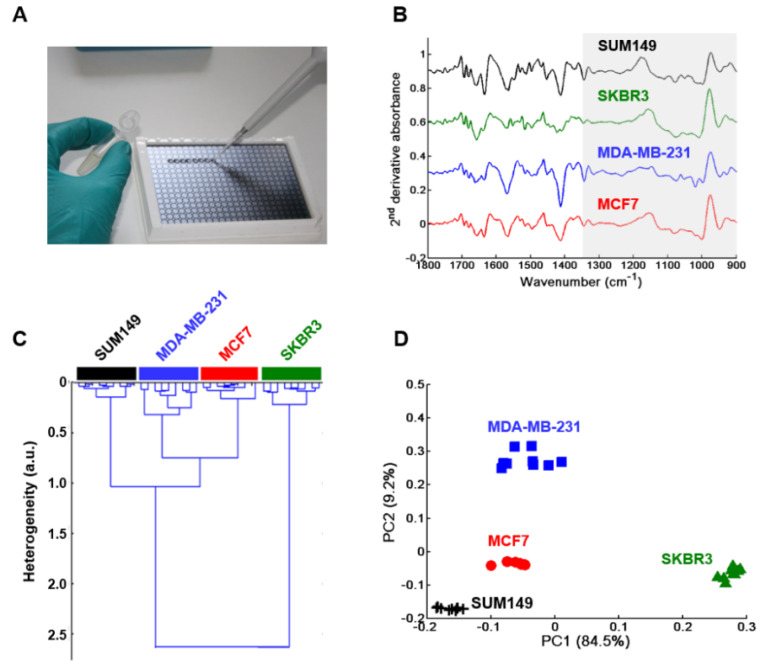
Figure 1.
High-throughput Fourier Transform InfraRed (FTIR) spectroscopy of GAGs extracted from conditioned media (secretome) of MCF7, MDA-MB-231, SKBR3 and SUM149 cells. (A) Photograph of a silicon plate with sample deposits; (B) Comparison between normalized mean second derivative spectra of conditioned media (CM) from the four cell lines. Spectra are offset for clarity; (C) HCA analysis and (D) PCA score plot of MCF7 (full red circles), MDA-MB-231 (full blue squares), SKBR3 (full green triangles), and SUM149 (black crosses). Both analyses were performed on normalized mean second derivative spectra using the frequency range 1350–900 cm−1.

