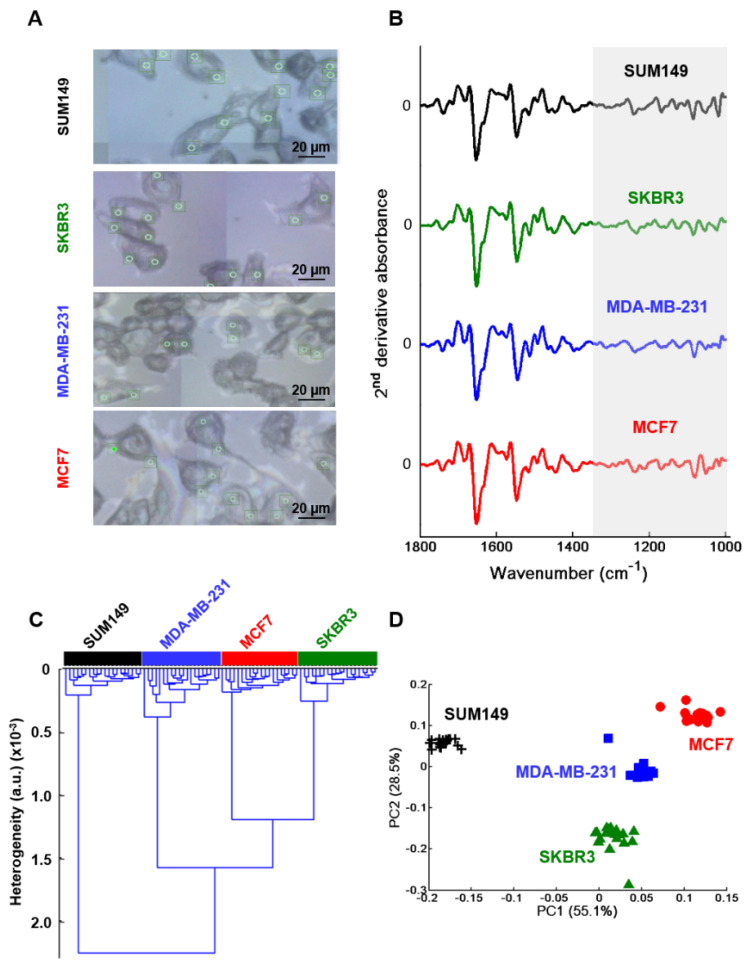
Figure 5.
Synchrotron FTIR microspectroscopy of the cytoplasm of MCF7, MDA-MB-231, SKBR3 and SUM149 fixed single cells. (A) The white light image of each cell type showing the measurement points (green circle); (B) Normalized second derivative mean spectrum (n = 20) from the cytoplasm of the four cell lines. Spectra are offset for clarity; (C) HCA analysis and (D) PCA score plot of MCF7 (full red circles), MDA-MB-231 (full blue squares), SKBR3 (full green triangles) and SUM149 (black crosses). Both analyses were performed on normalized mean second derivative spectra using frequency range 1350–990 cm−1.

