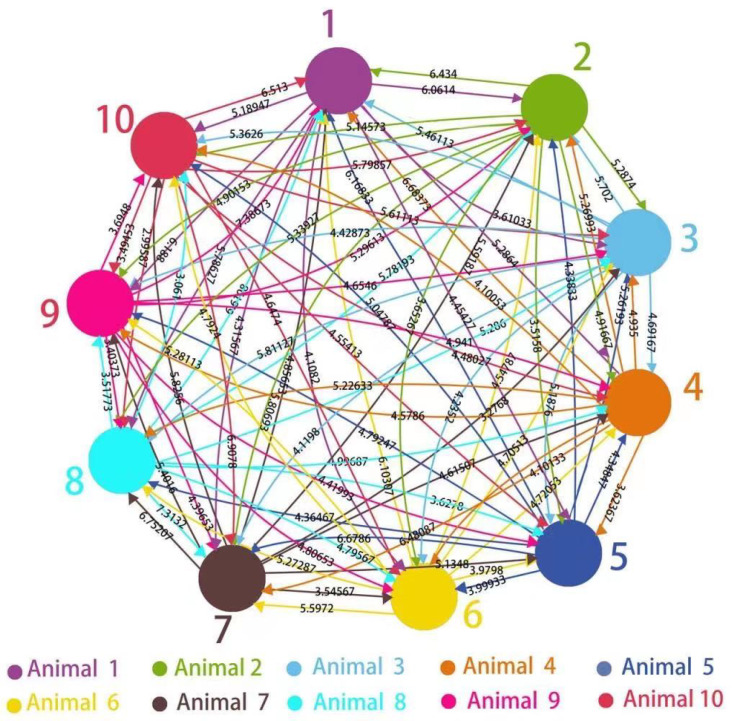
Figure 3.
The new graph-theoretic interpretation of the closeness of the group of animals in the experiment, where each vertex corresponds to an animal and each directional edge is associated with a weight to measure the time-averaged closeness of animal i to animal j against the rest of the group, where .

