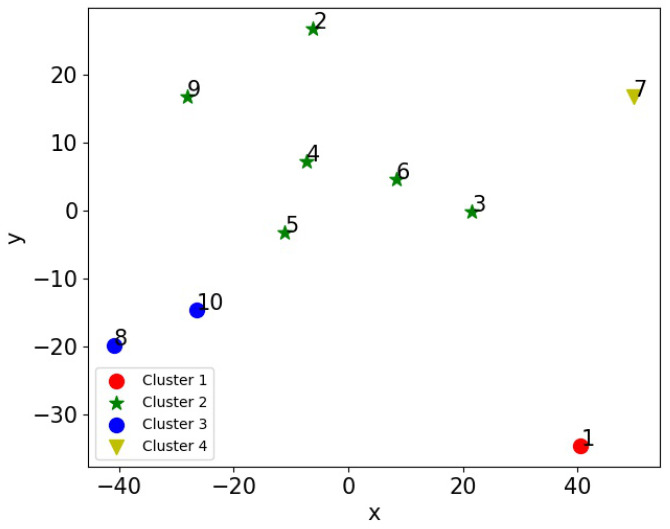
Figure 4.
The locations of 10 cattle in an abstract 2-D space obtained by MDS based on the pairwise affinities. Note that the coordinates on the x and y axes have no physical meaning but indicate the relative closeness between animals. Animals closer to each other in the plot have stronger interactions. The cattle are grouped into four clusters by the K-means clustering algorithms, as indicated by the four different markers.

