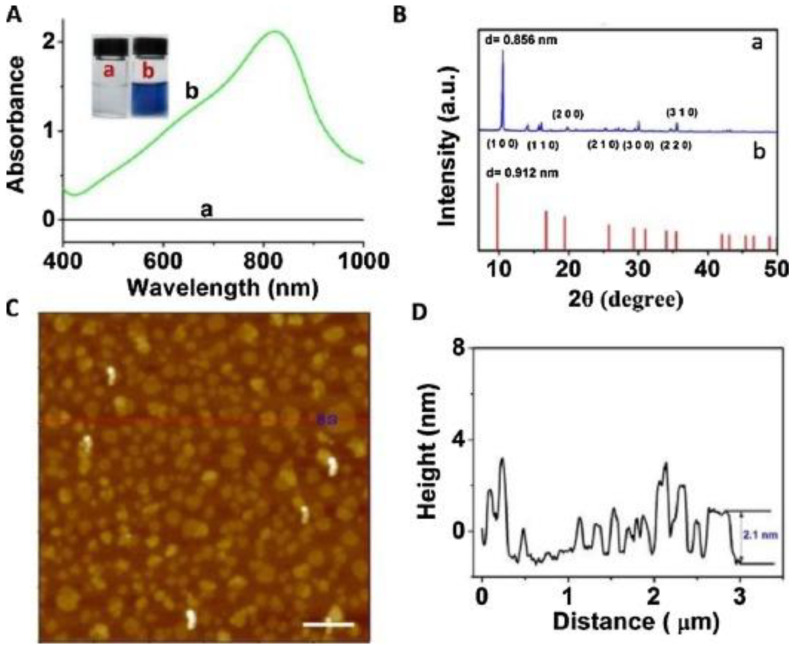
Figure 4.
(A) UV–vis-NIR absorption spectra of (a) MoO3 nanosheet and (b) MoO3−x nanosheet dispersions. (B) XRD pattern of (a) the MoO3−x nanosheets, and (b) JCPDs card no. 21-0569 of hexagonal phase of MoO3. (C) AFM image of MoO3−x nanosheets (scale bar, 500 nm). (D) Height profile. Reprinted with permission from reference [55].

