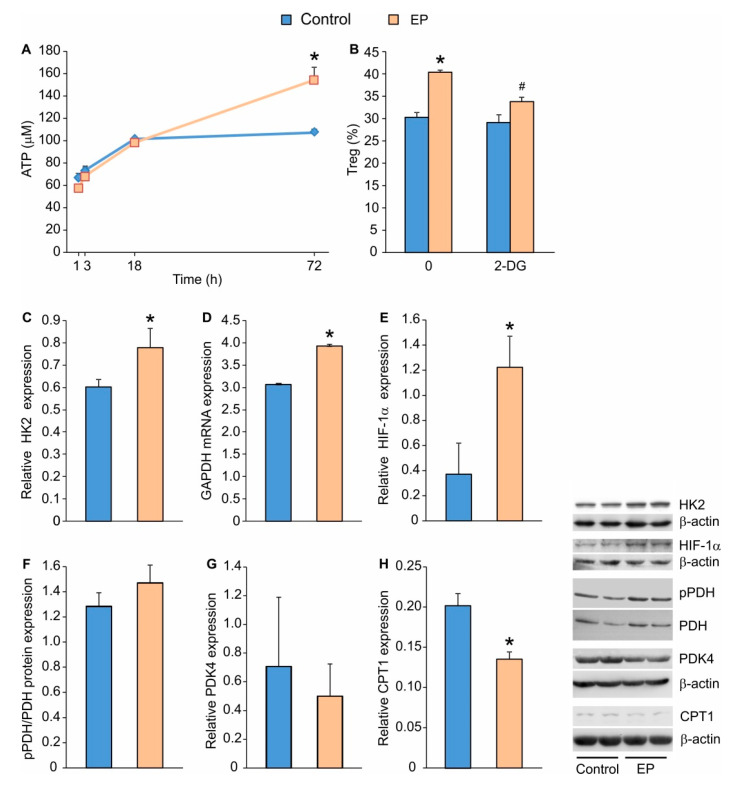
Figure 2.
The influence of EP on metabolic pathways in differentiating Treg. (A) ATP cell content measured by chemiluminescence method in cells first exposed to a conventional Treg differentiating cocktail for 24 h and after EP treatment, at indicated time points. (B) The effect of 2-deoxyglucose (2-DG) on Treg (CD4+CD25highFoxP3+) proportion in control cells or EP-treated cells, measured 72 h after 2-DG addition. Relative protein expression (compared to β-actin or the total protein form) measured by immunoblot 72 h after EP administration: (C) HK2, (E) HIF-1α, (F) phosphorylated PDH (pPDH), (G) PDK4 and (H) CPT1. (D) Relative GAPDH mRNA expression (compared to β-actin) measured 72 h after EP administration. Representative blots are shown on the right-hand side. * p < 0.05 represents the significant difference of EP-treated cells in comparison to control cells, while # p < 0.05 represents the significant difference between 2-DG+EP-treated cells in comparison to EP-treated cells.

