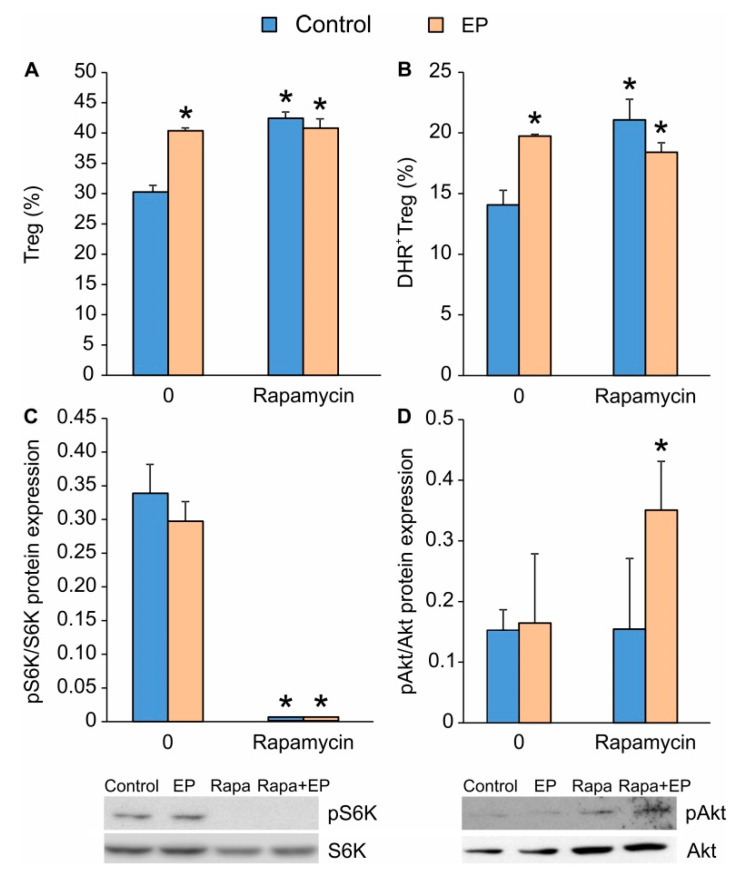
Figure 4.
The influence of EP on mTOR activity. (A) The proportion of Treg (CD4+CD25highFoxP3+) and (B) the number of ROS-producing Treg (CD4+CD25high) 72 h after the treatment with EP and/or rapamycin (Rapa). (C) The expression of phosphorylated S6K (pS6K) and (D) phosphorylated Akt (pAkt) normalized to the expression of total protein forms measured by immunoblot 72 h after EP and/or rapamycin administration. Representative blots are shown below the graph. * p < 0.05 represents the significant difference of EP- or rapamycin-treated cells in comparison to untreated control cells.

