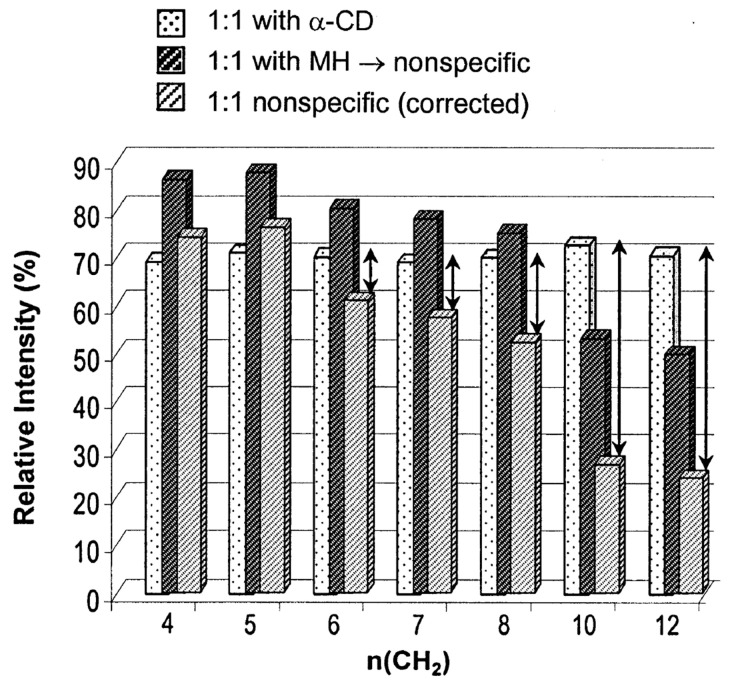
Figure 7.
Relative intensities of the α-CD/diacid complexes (white bar with dots), the maltohexaose/diacid complexes (blank bar with dark hatches), and the maltohexaose/diacid complexes after the correction using the response factor (grey bar with light hatches). The arrows correspond to the contribution of inclusion complexes, assuming the nonspecific adducts in both complexes contribute equally. Reprinted from Reference [155], Copyright (2002), with permission from Elsevier.

