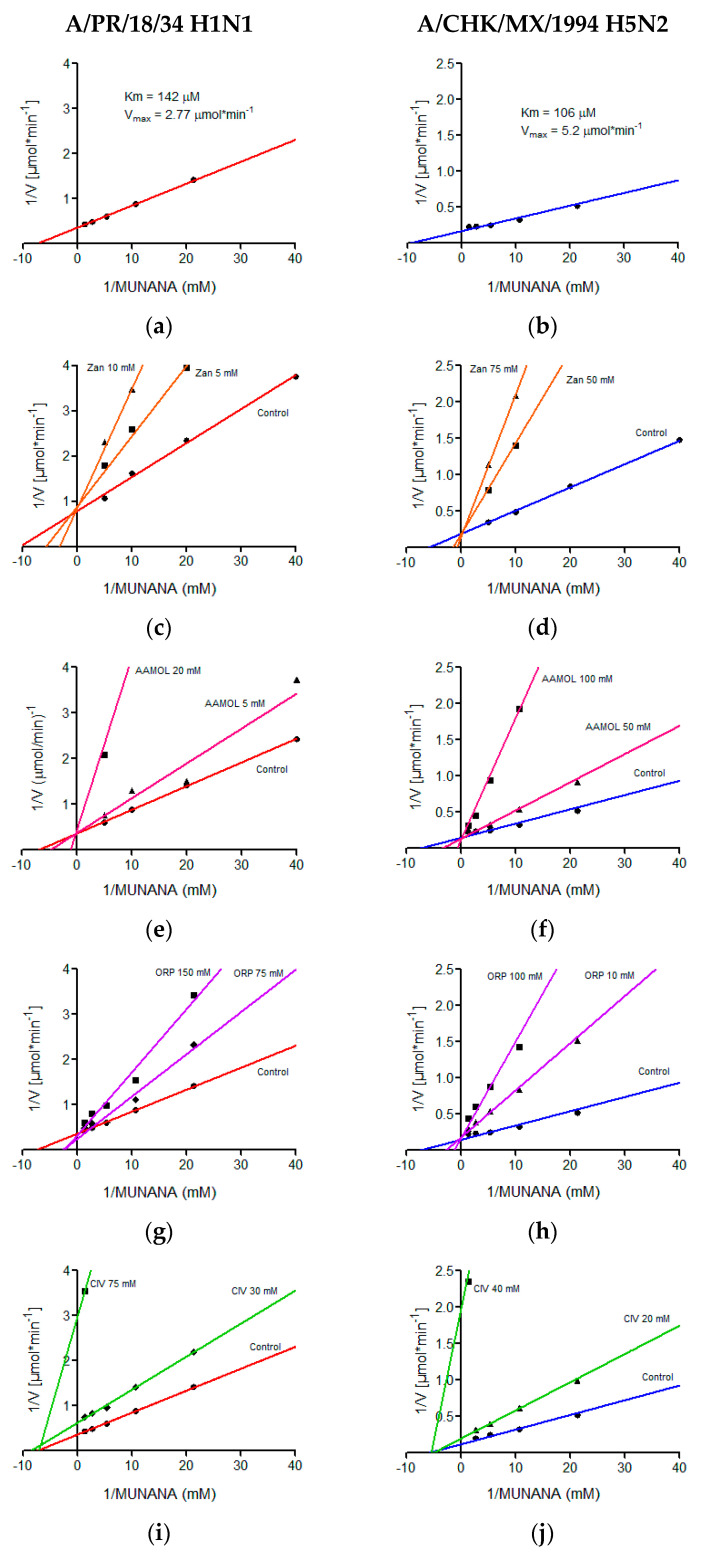
Figure 6.
Lineweaver-Burk diagrams of two influenza A virus strains. Panels (a), (c), (e), (g) and (i) report the kinetic analyses of viral strain A/PR/18/34 H1N1, while panels (b), (d), (f), (h) and (j) report the kinetic analyses of viral strain A/CHK/MX/1994 H5N2. Panels (a) and (b) show treatments with MUNANA as a substrate. Panels (c) and (d) present treatments with zanamivir; panels (e) and (f) with AAMOL; panels (g) and (h) with ORP; and panels (i) and (j) with CIV, respectively. The GraphPadPrism 6.04 program was used to determine values of the inhibition constant (Ki) for the molecules analyzed.

