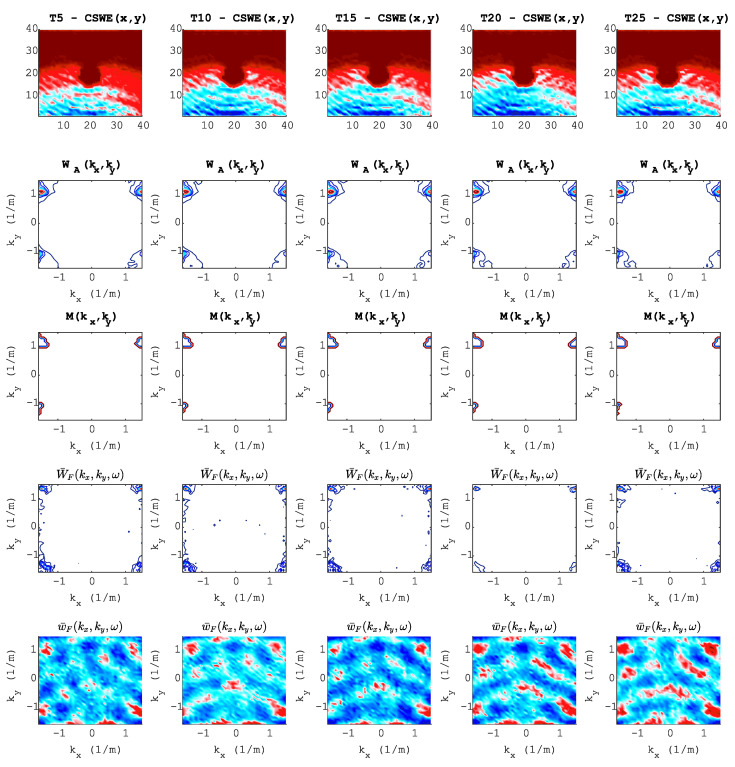
Figure 16.
Preprocessing pipeline: Each column represents each torque value (T). Each row represents each processing step at s. Row 1, wavefield image of a standing wave; Row 2, averaged wavefield image in the wavenumber domain; Row 3, adaptive filter mask; Row 4, filtered wavefield image in the wavenumber domain; Row 5, wavefield image in space domain after adaptive filtering.

