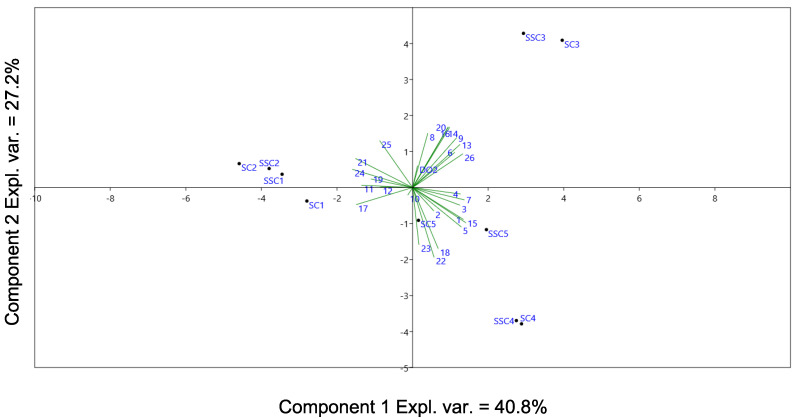
Figure 4.
PC1 (exp. variance = 40.8%) vs. PC2 (exp. variance = 27.2%) model for St. Magdalener wines. Volatile compound relative abundances and measured dissolved oxygen were used as variables. Volatile compound labels (1–26) are explained in Table 4.

