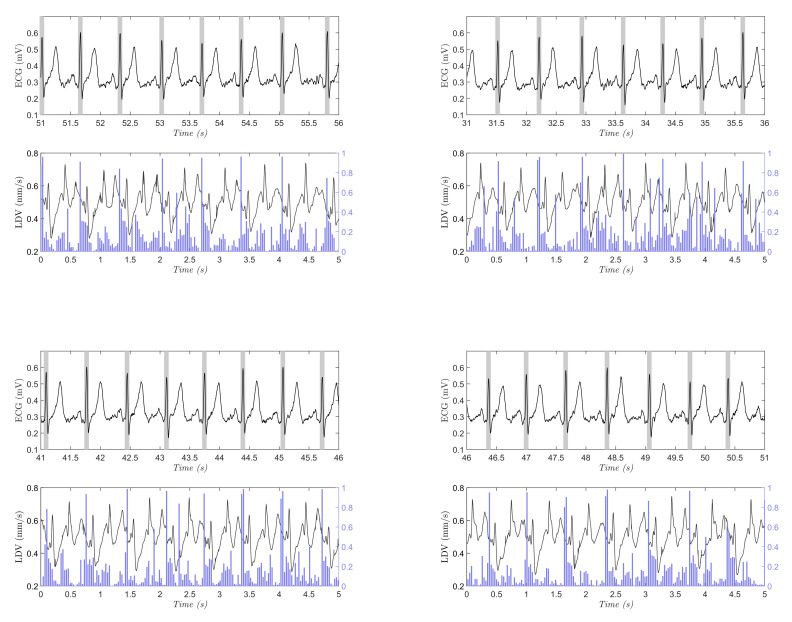
Figure 8.
Four sample testing results on the full-length (10-min long), LDV signal (the signal was smoothed for visualization purposes only). In each subfigure, the ECG signal with gold-standard beats (grey rectangles centered with the R peak from the ECG), and the output probability (vertical blue line) for the beat class obtained with support vector machines are shown. The beats in the ECG signal are shown with rectangles for better visibility.

