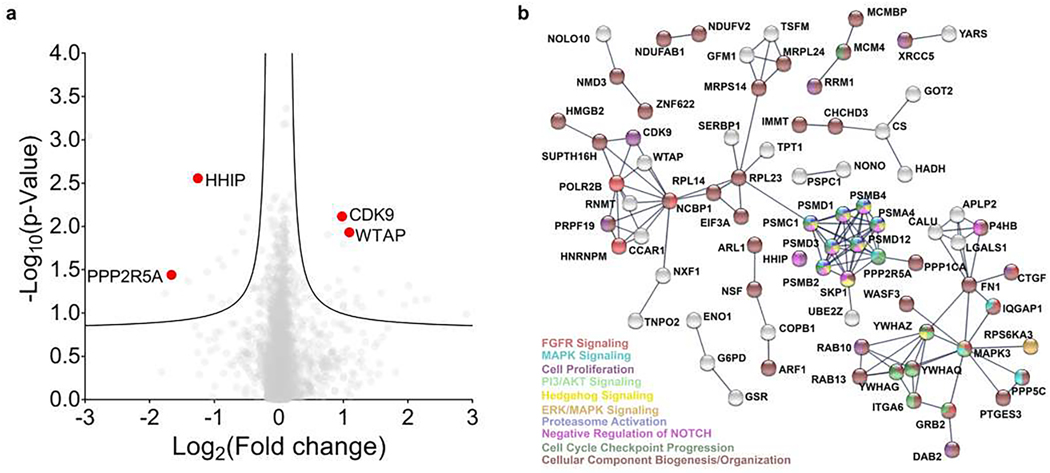
Fig. 5 |. Proteomics analysis of HUVECs treated with TGP-377.
a, Volcano plot showing the relative fold changes of >4,000 detected proteins. Data are reported as the mean of three biologically independent replicates (n= 3). The statistical significance was determined by a two-sided Student’s t-test and was not adjusted for multiple comparisons. b, STRING analysis of the 160 proteins affected by TGP-377. The analysis reported interaction scores of >0.9 (highest confidence) and is consistent with previous studies of VEGFA upregulation (Supplementary Table 7).

