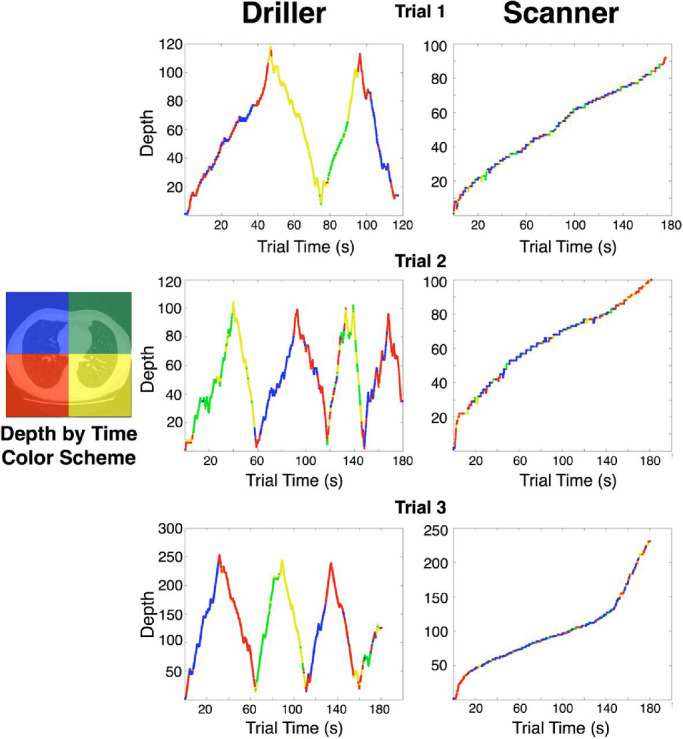
Figure 1.

Description of 3D scan paths from Drew et al. (2013), who recorded eye position in each quadrant (left panel) as observers scrolled through CT scans in depth. Color indicates the quadrant of the image the radiologist was looking at during a given time in the trial. “Depth” on the y-axis refers to the 2D orthogonal slice of the scan currently viewed. In this study, radiologists looking for nodules on chest CTs could be characterized into two groups based on their search strategies. “Drillers,” such as the radiologist whose data appear in the middle column, tend to look within a single region of an image while quickly scrolling back and forth in depth through stacks of images. “Scanners,” such as the radiologist whose data appear in the right column, scroll more slowly in depth, and typically do not return to depths that they have already viewed. Scanners make more frequent eye movements to different spatial locations on the image, exploring the current 2D slice in greater detail. Note that although scanners spend more time than drillers making saccades per slice, neither scanners nor drillers visit all four quadrants of the image on every slice. Thus some regions of some slices may never be viewed foveally by either group. (Reprinted from Drew et al., 2013).
