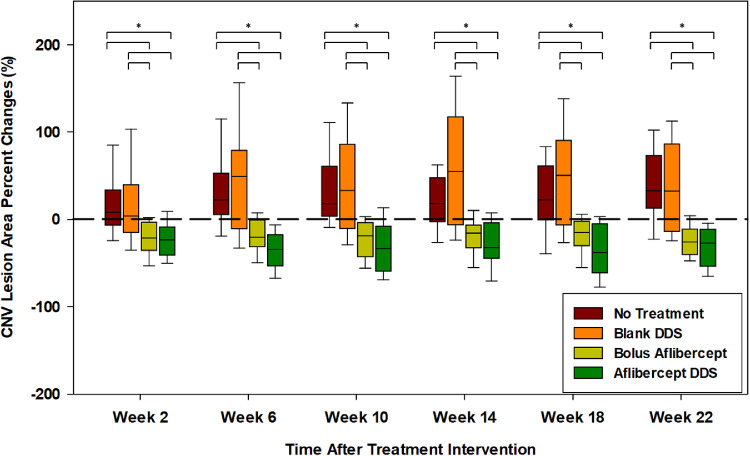
Figure 4.
Boxplot of percent changes in CNV lesion area relative to week 0 (taken as 0%) for the four experimental groups: (1) no treatment (dark red), (2) blank DDS (orange), (3) bolus aflibercept (yellow-green), and (4) aflibercept-DDS (green) at corresponding time points. Asterisk indicates statistically significant differences between the two groups using Holm-Sidak multiple comparison test after repeated-measures two-way ANOVA (P < 0.05). Note: one rat in the aflibercept-DDS group died after anesthesia at week 14; the number of lesions reduced from 29 to 19 thereafter.

