Figure 5.
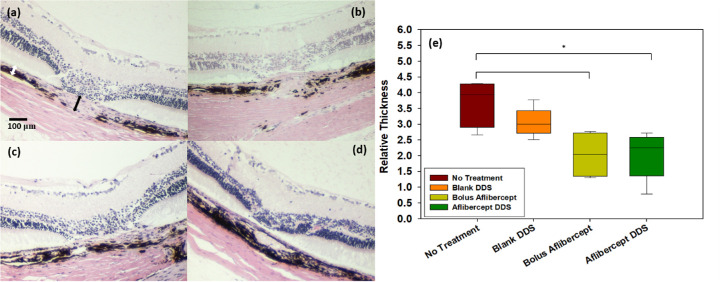
Histology analysis of CNV lesions. Representative images of CNV lesions from (a) no-treatment, (b) blank DDS, (c) bolus aflibercept, and (d) aflibercept-DDS groups. (e) Quantification of CNV lesion relative thickness for the four experimental groups, where the asterisk indicates statistically significant differences between the two groups using Holm-Sidak multiple comparison test after ANOVA (P < 0.05). Note: the relative thickness was measured by taking the ratio of the thickness from the bottom of the pigmented choroid to the top of the CNV lesion (black arrow in a) to the thickness of adjacent, normal choroid (white arrow in a).

