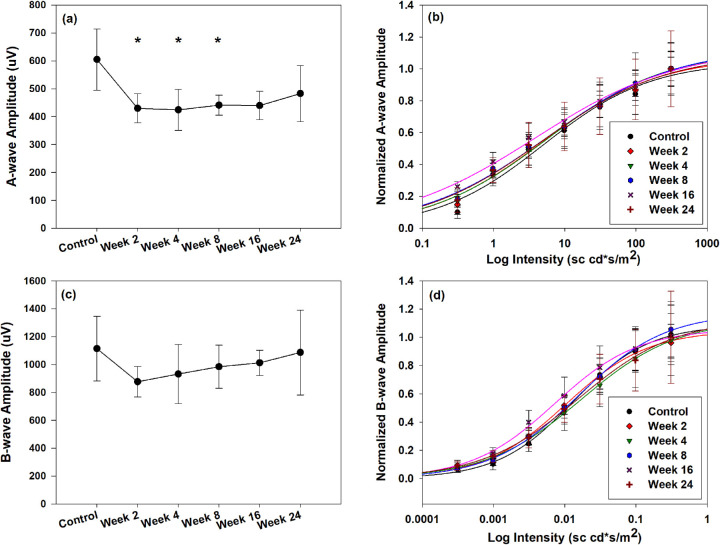
Figure 6.
ERG responses before and after IVT injection of blank DDS. (a) Maximum a-wave amplitudes in response to single bright flashes (intensity of 311 sc⋅cd⋅s⋅m−2). (b) Average a-wave intensity-response function. Flash intensities range from 0.311 to 311 sc⋅cd⋅s⋅m−2. Solid lines are results of the Naka-Rushton analysis. (c) Maximum b-wave amplitudes in response to single bright flashes (intensity of 311 sc⋅cd⋅s⋅m−2). (d) Average b-wave intensity-response function. Flash intensities range from 0.000311 to 0.311 sc⋅cd⋅s⋅m−2. Solid lines are results of the Naka-Rushton analysis. Amplitudes of intensity-response functions for a- and b-wave were normalized by their maximum response, respectively. Error bars represent standard error (n = 6). Asterisk indicates statistically significant difference compared to control (prior to IVT injection) (P < 0.05).

