Figure 1.
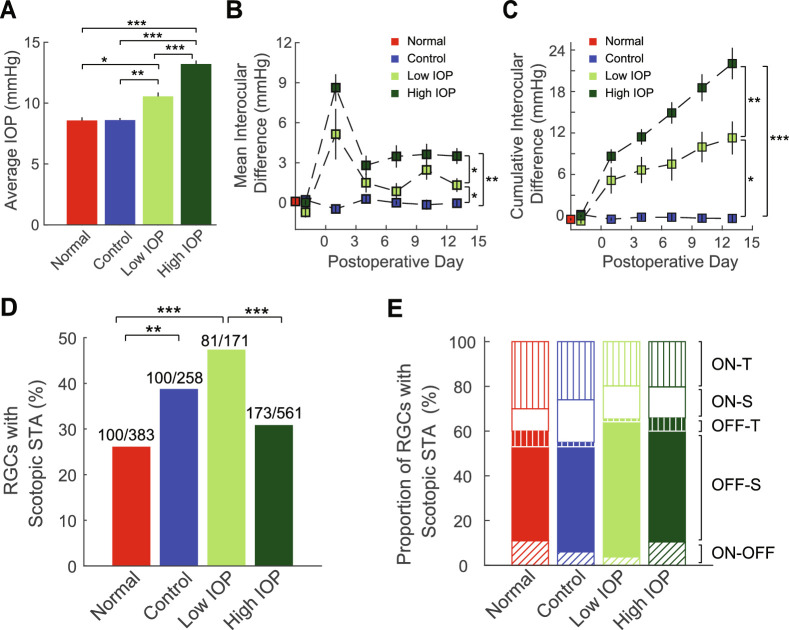
IOP and RGC sampling. For all panels, red = untreated eyes (normal), blue = saline injected eyes (control), bright green = bead injected eyes (low IOP), and dark green = bead injected eyes (high IOP). (A) Average IOP throughout the 2-week study. (B) Average interocular IOP difference per day throughout the 2-week postoperative period. Vertical bars represent 1 SEM. (C) Cumulative interocular IOP difference per day throughout the 2-week postoperative period. Vertical bars represent 1 SEM. (D) Among sampled RGCs, the proportion of the cells that showed a scotopic STA. Numbers above each bar indicate how many RGCs showed photopic STAs (denominator) and scotopic STAs (numerator). (E) Among RGCs that showed scotopic STAs, the proportion of ON-transient cells (ON-T), ON-sustained cells (ON-S), OFF-transient cells (OFF-T), OFF-sustained cells (OFF-S), or ON-OFF cells for each group. Open areas = ON cells, filled areas = OFF cells, vertical lines = ON or OFF transient cells; no lines = ON of OFF sustained cells, and oblique lines = ON-OFF cells. There is no difference in the distribution of RGC subtypes according to experimental group. *P < 0.05; **P < 0.01; ***P < 0.001. Vertical lines indicate 1 SEM.

