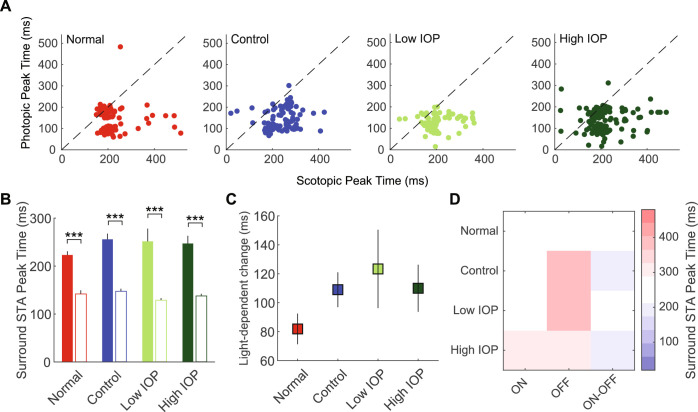
Figure 6.
Scotopic and photopic surround STA peak time. (A) Scatter plot of the scotopic (x-axis) and photopic (y-axis) surround STA peak time for RGCs in normal (red), control (blue), low IOP (bright green), and high IOP (dark green) groups. (B) Average peak time for each group. Filled bars represent scotopic peak time; empty bars represent photopic peak time. (C) Changes in peak time due to light level change (scotopic -- photopic). (D) Heatmap shows the average surround STA peak time for each RGC subtype according to experimental group. ***P < 0.001. Vertical lines indicate 1 SEM.

