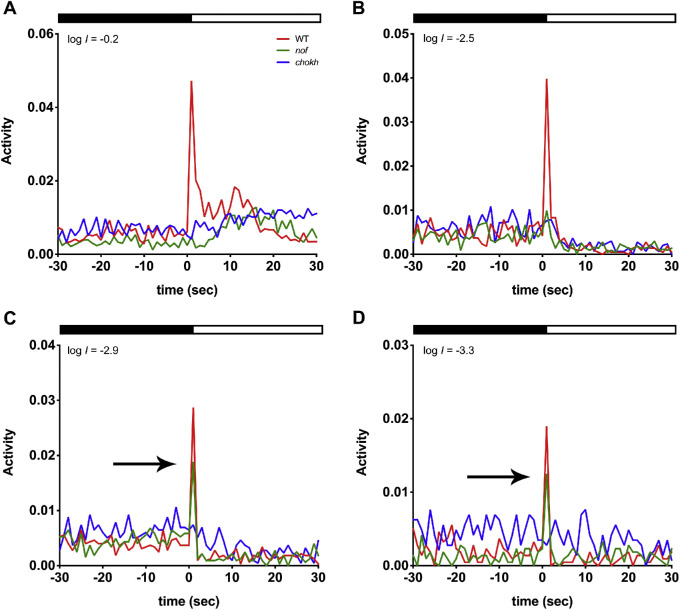
Figure 4.
The nof mutants displayed a light-On VMR comparable to that of WT larvae at the lowest light intensities (log I = −2.9 and −3.3). The light-On VMRs of WT larvae (red), nof (green), and chokh/rx3 mutants (blue) were measured at 6 dpf with the following light intensities: log I = −0.2 (A), −2.5 (B), −2.9 (C), and −3.3 (D). The experiments were conducted and resulting data plotted as described in Figure 3. The numbers of animals used are as follows: For (A, B), n = 72 for WT larvae and nof mutants, and n = 48 for chokh/rx3 mutants; for (C), n = 108 for WT larvae and nof mutants, and n = 72 for chokh/rx3 mutants; for (D), n = 36 for WT larvae and nof mutants, and n = 24 for chokh/rx3 mutants. As the light intensity was reduced, WT larvae and the nof mutants displayed fast responses (<2 s after light onset) that became more comparable. The arrows in (C, D) indicate WT and nof mutants displayed a similar fast response in the first 2 s. The chokh/rx3 mutants, however, did not display any fast response. All larvae lacked sustained responses (>2 s after light onset) when the stimulus light intensity was lower than log I = −2.5.

