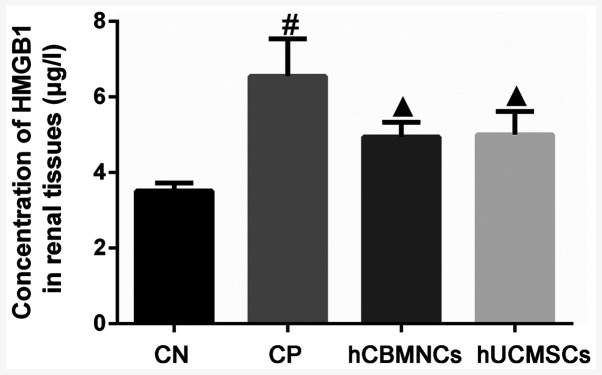
Figure 4.
Changes in HMGB1 concentrations in the renal tissues of each group (µg/l). HMGB1 concentrations were determined by ELISA. Data are presented as the mean ± SD (n=6/group). #P<0.01 vs. the CN group. ▲P<0.01 vs. the CP group. HMGB1, high mobility group box 1; CN, normal control; CP, cisplatin model; hCBMNCs, human cord blood mononuclear cells; hUCMSCs, human umbilical cord-derived mesenchymal stem cells.

