FIGURE 5.
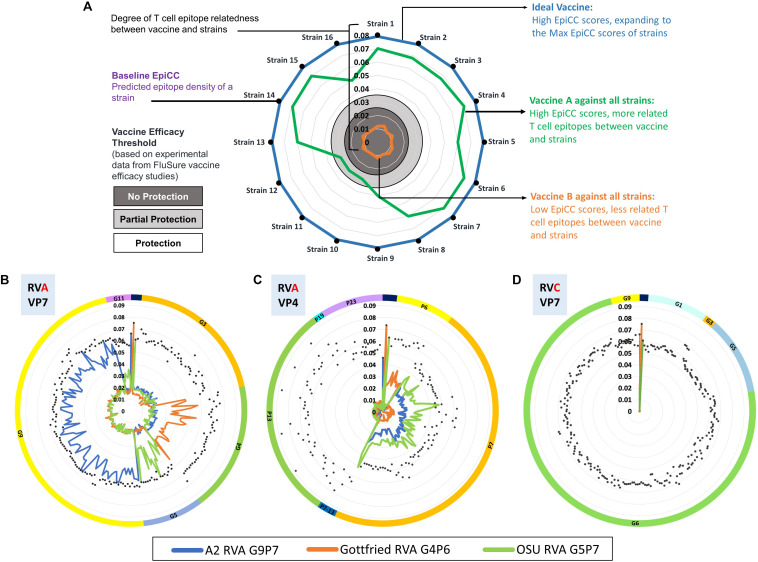
EpiCC radar plot. Radar plots are used to visualize the relationship between vaccine strains and circulating strains. In the top plot, Panel (A) for illustration purposes, 16 typical circulating swine influenza A virus strains are presented on the perimeter of the chart. The EpiCC scores of their HA antigens (hemagglutinin) are indicated by their distance from the center to the perimeter. Vaccine efficacy thresholds for protection (white area), partial protection (light gray area) and no protection (dark gray area) have been based on experimental data from efficacy studies of swine Influenza A virus vaccines (17). The blue line represents an example of an ideal vaccine strain that contains T cell epitopes fully matched to all the circulating strains. The green line represents an example of an influenza vaccine strain HA protein that contains T cell epitopes well matched to the majority of circulating strains. The orange line represents an example of a vaccine strain HA protein that contains T cell epitopes not well-matched to any of the circulating strains. This example is intended to illustrate how EpiCC provides guidance on vaccine selection but does not provide data on any specific influenza strains. An example of how EpiCC can be used is provided for a set of swine rotavirus vaccines and circulating rotavirus strains. Rotaviruses (RVs) are among the most common causes of acute diarrheal disease in humans and swine. Speciation of RVs is based on sequencing of the viral protein (VP) 6, the middle capsid protein. Rotavirus group A (RVA) is the most prevalent and pathogenic species of RV. The VP7 and VP4 proteins stimulate neutralizing antibodies and are used as a binary classification system for genotypes (G and P genotypes, respectively). Due to the binary classification system, we have performed an EpiCC analysis based on comparisons of the VP7 and VP4 components of each strain and their equivalent viral protein-specific vaccine components VP7 and VP4. In Panel (B), we compare RVA strain VP7 proteins to the VP7 component of the vaccine, and in Panel (B) we compare RVA strain VP4 proteins to the VP4 component of the vaccine. The viruses are sorted by genotype (by G for Panel (B) and by P for Panel C); the classification is highlighted by the color of the outermost circle (orange for G3 and green for G4 and so on). Each of the three RVA strains in the ProSystems vaccine is represented with a different colored line: the blue line represents the A2 RVA strain which contains viral proteins derived from genotypes G9 and P7), the orange line the Gottfried RVA strain (which contains G4 and P6) and the green line the OSU RVA strain (G5 and P7). In Panel (B), the EpiCC scores of the A2 vaccine strain (G9P7) are highest against strains that fall into the same genotype (G9) and low for all other genotypes. The EpiCC scores of the Gottfried strain (G4P6) are highest for strains that are in genotype G4 but low against other strains. This suggests that vaccine strains are more related to homologous field strains than to other strains. Therefore, the T cell epitope content of circulating swine rotavirus strains is highly genotype specific explaining why it is necessary to use genotype-specific RVA vaccines to protect against field strains. Panel (D) illustrates the expected finding that swine RVA vaccine strain VP7 has no conservation against circulating strains from rotavirus group C (RVC) VP7. If T cell epitopes are protective against swine rotavirus, a ‘universal’ RV vaccine would need to include T cell epitopes representing all of the genotypes.

