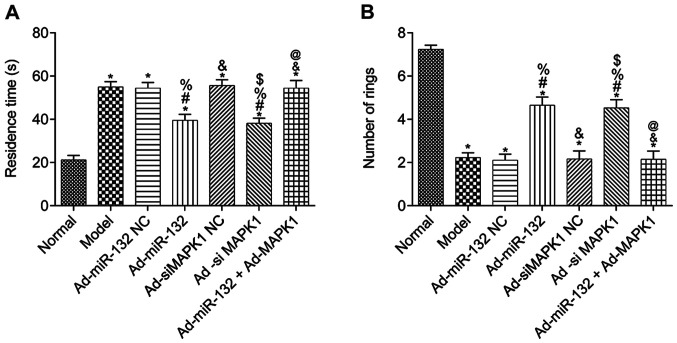
Figure 3.
Learning and memory ability of rats from different groups (n=10). (A) Latency time in water maze test. (B) Number of times passing through the rings. *P<0.05 vs. Normal group; #P<0.05 vs. Model group; %P<0.05 vs. Ad-miR-132 NC group; &P<0.05 vs. Ad-miR-132 group; $P<0.05 vs. Ad-siMAPK1 NC group; @P<0.05 vs. Ad-siMAPK1 group. NC, negative control; miR, microRNA; si, small interfering.

