
Figure 3.
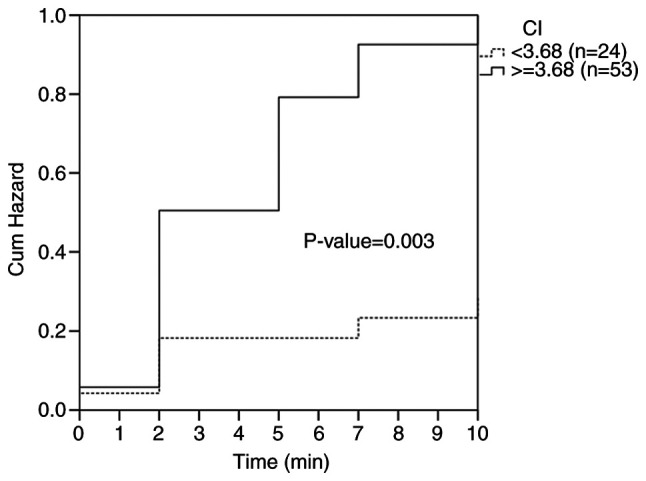
Development of hypotension during observation period according to Kaplan-Meier curve. Dotted line, CI <3.68; solid line, CI ≥3.68. CI, cardiac output index.
Official websites use .gov
A
.gov website belongs to an official
government organization in the United States.
Secure .gov websites use HTTPS
A lock (
) or https:// means you've safely
connected to the .gov website. Share sensitive
information only on official, secure websites.
Development of hypotension during observation period according to Kaplan-Meier curve. Dotted line, CI <3.68; solid line, CI ≥3.68. CI, cardiac output index.