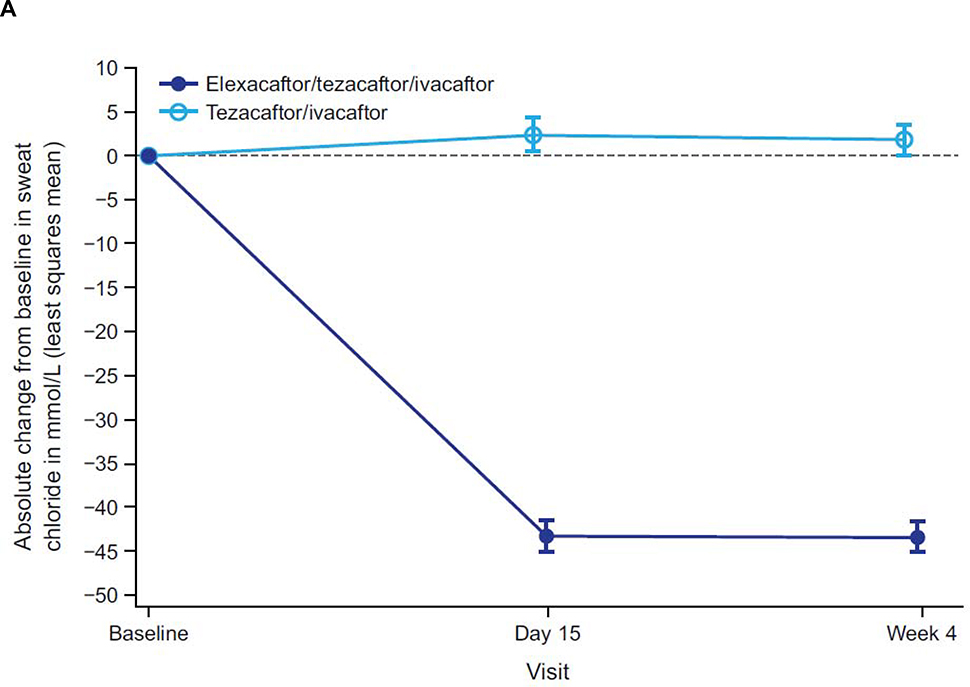
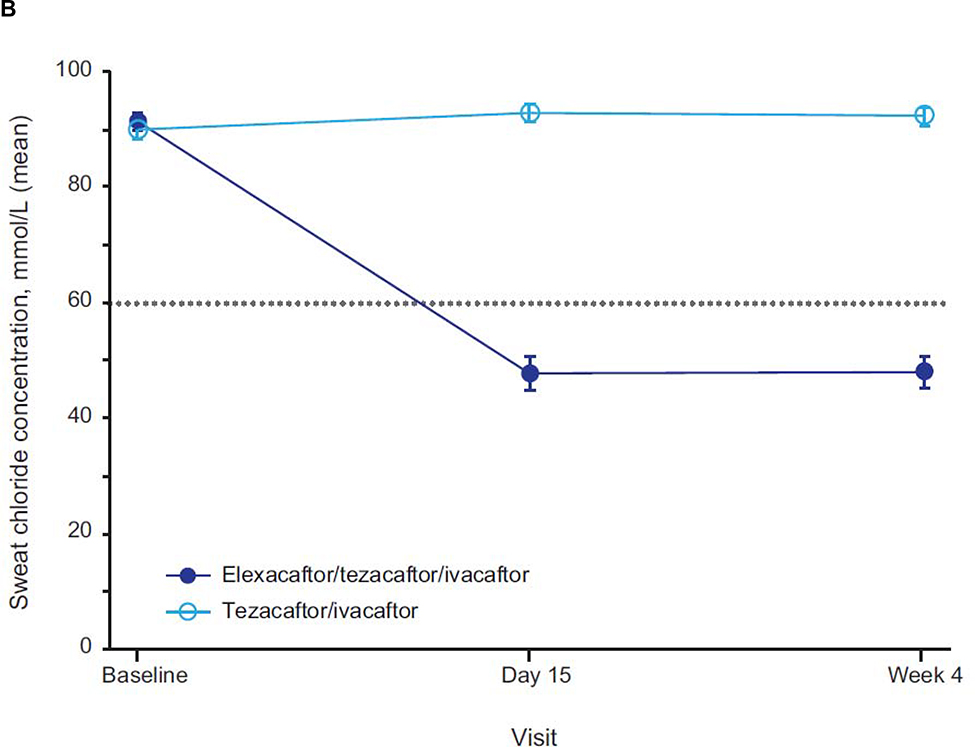
Figure 3. Absolute Change Over Time in Sweat Chloride Concentration From Baseline.
Panel A shows the absolute change in sweat chloride from baseline (measured at the end of the tezacaftor/ivacaftor run-in period). Panel B shows the mean sweat chloride concentration for each treatment group by visit. Data are least squares means based on a mixed-effects model for repeated measures for panel A and sample means for panel B; error bars indicate standard errors; the dashed line in panel A indicates no change from baseline; the dotted line in panel B indicates the 60 mmol/L diagnostic threshold for sweat chloride concentration.18


