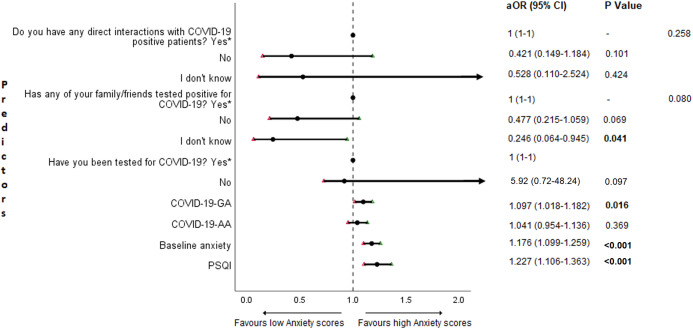
Figure 6. Forest plot showing adjusted binary logistic regression analysis of follow-up anxiety scores.
aOR adjusted odds ratio; odds ratio adjusted for age, gender, year of study, urban/rural residential status, family’s monthly income; 95%CI 95% confidence interval. Significant P values are shown in bold.

