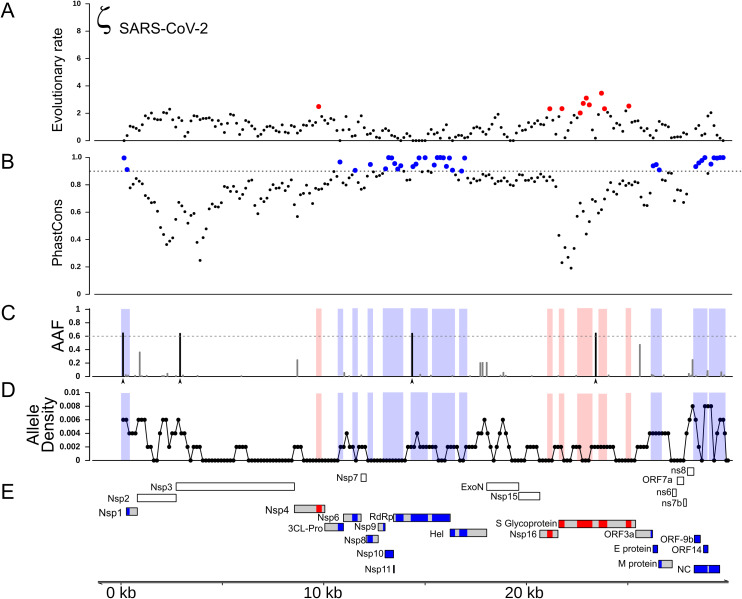
Figure 2. Distribution of positive selection, PhastCons conservation, and polymorphic variation across the SARS-CoV-2 genome.
(A) Evolutionary rate (ζ) with sites under significant branch specific selection as red dots. (B) Panel depicting conservation values (PhastCons) with highly conserved windows (PhastCons >0.9) as blue dots over the dashed line along the SARS-CoV-2 genome. (C) Alternative allele frequency for 5,000 high quality genomes available in NCBI. Dotted line represents an arbitrary threshold of 0.6 and SNPs in strong linkage disequilibrium are highlighted with arrowheads under black bars. (D) Allele density in windows of 500 bp with a step of 150 bp. Red boxes in B and C symbolize regions under positive selection, while blue boxes represent high conservation. (E) Annotations for all the mature proteins known to be expressed in SARS-CoV-2.

